- December 17, 2025
- Posted by: admin
- Category: BitCoin, Blockchain, Cryptocurrency, Investments
On-chain data shows the Bitcoin Inter-exchange Flow Pulse (IFP) has rapidly been going down recently, a sign of cooling derivatives interest.
Bitcoin IFP Has Witnessed A Plunge Recently
In a new post on X, CryptoQuant community analyst Maartunn has talked about the trajectory that the Bitcoin IFP has been following recently. The IFP refers to an on-chain indicator that measures the BTC flows taking place between spot and derivatives exchanges.
When the value of this metric is going up, it means investors are ramping up transactions to derivatives platforms. Such a trend can be a sign that demand for speculation is on the rise.
On the other hand, the indicator witnessing a decline implies fewer coins are traveling from spot exchanges to derivatives ones. This kind of trend can suggest traders are lowering their appetite for risk.
Now, here is the chart shared by Maartunn that shows the trend in the Bitcoin IFP and its 90-day moving average (MA) over the past decade:
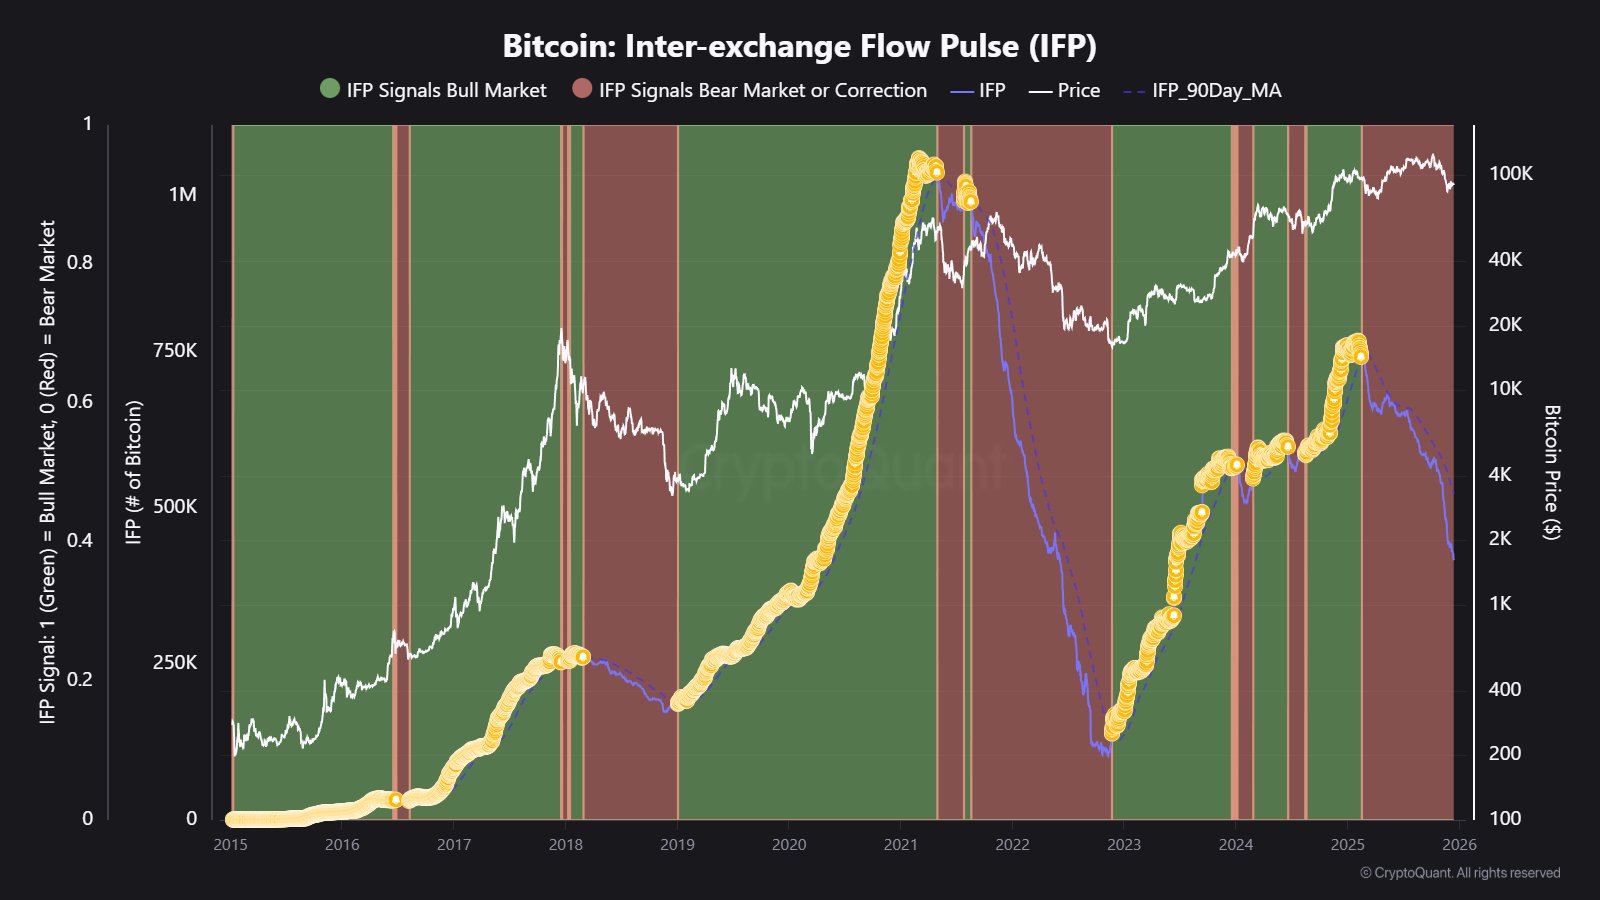
As is visible in the above graph, the Bitcoin IFP was witnessing an uptrend in the last few months of 2024, but with the start of this year, a reversal in the indicator occurred. The switch to a downtrend meant that its value slipped below the 90-day MA, something that has historically signaled bearish conditions.
Over the course of 2025, the IFP has continued its downward trajectory, but lately, the decline has accelerated, indicating that derivatives interest is cooling off fast.
Two cycles ago, the IFP sliding below its 90-day MA led into the 2018 bear market. In the 2021 bull market, the bear signal on the IFP was initially followed by the second half of that bull run, but then the 2022 bear market took over as the metric failed to recover.
A similar trend has been witnessed this year as well, with Bitcoin exploring new all-time highs (ATHs) despite the IFP suggesting bearish conditions. The recent acceleration in the indicator’s downtrend, however, has been accompanied by a bearish period in the asset’s price. Only time will tell whether this is a repeat of the pattern from the last cycle, or if risk appetite will make a comeback among investors and the IFP will reverse course.
In some other news, the Bitcoin treasury companies have seen their holdings go up recently, despite the drawdown that the market has faced, as pointed out by Glassnode co-founder Rafael in an X post.
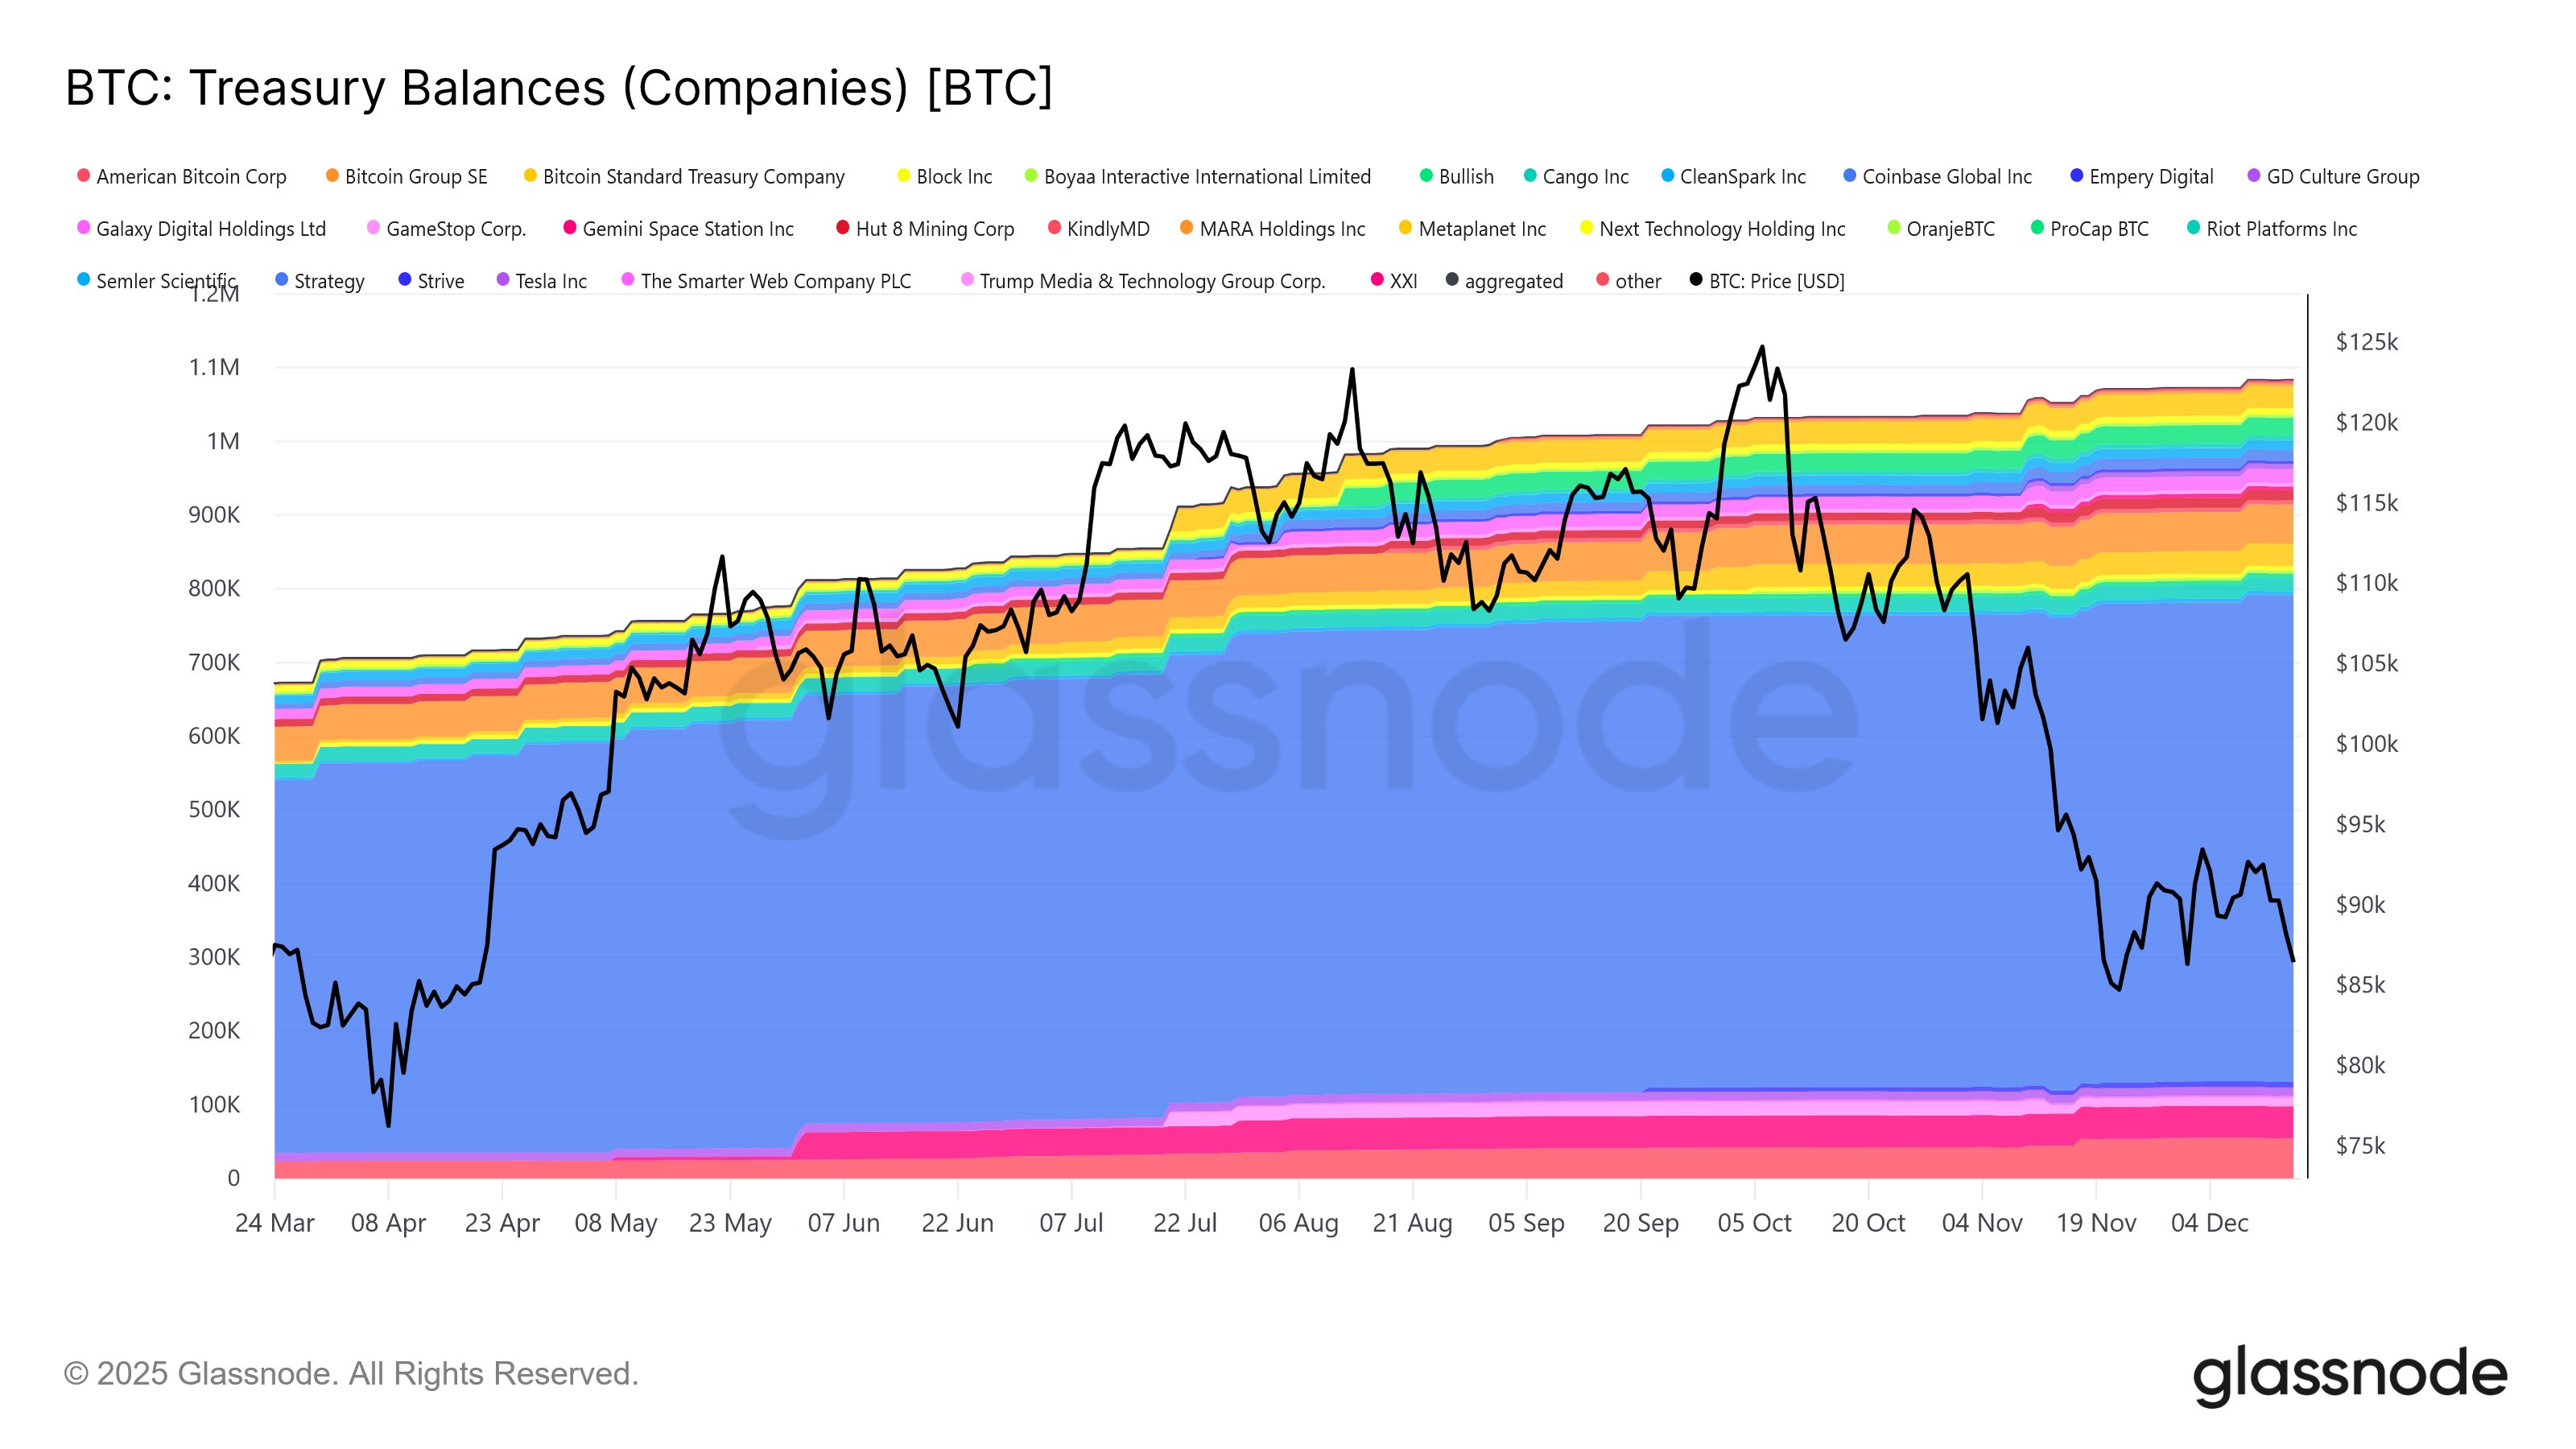
From the chart, it’s apparent that since Bitcoin started declining from its ATH above $126,000, the treasury companies have still continued a net upward trajectory. “Not seeing much of the alleged forced selling here despite some equities trading below mNAV,” noted Rafael.
BTC Price
At the time of writing, Bitcoin is trading around $87,500, down over 7% in the last week.


